You’ve assembled the team, locked the scope, and kicked off the project. Three weeks later, you’re buried in Slack messages, someone’s two days behind on a deliverable, and the client just asked, “Are we still on budget?” Without the right project management KPIs, you’re flying blind—reacting to problems after they’ve already derailed your timeline.
Studies consistently show that roughly 30% of projects fail to meet their original goals, and a leading cause is the absence of meaningful project tracking metrics. Key performance indicators for project managers aren’t just numbers on a spreadsheet. They’re early-warning signals, accountability tools, and the shared language that keeps sponsors, teams, and stakeholders aligned.
In this guide, you’ll learn which project KPIs matter most, how to calculate them, how to choose the right set for your specific project type, and how to turn raw data into decisions using a KPI dashboard for project managers. Whether you run software sprints, construction builds, or marketing campaigns, this article gives you a practical framework to track what matters—and ignore what doesn’t.
What Are Project Management KPIs?
A project management KPI is a quantifiable measure tied to a specific project objective. It answers one question: Are we on track to deliver what we promised, when we promised it, within the budget we agreed to?
It helps to distinguish three terms people often conflate:
- Metrics are any data points you collect—lines of code written, hours logged, emails sent.
- KPIs are the critical few metrics that directly indicate progress toward project success.
- OKRs (Objectives and Key Results) sit at the organizational level and define what the business wants to achieve; project KPIs measure whether a specific project is contributing to those objectives.
Why do project performance metrics matter? Three reasons:
- Decision-making. A CPI of 0.82 tells you to intervene now, not after the budget is blown.
- Accountability. When everyone sees the same milestone completion rate, finger-pointing drops.
- Continuous improvement. Historical KPI data lets your PMO refine estimates and processes for the next project.
Core KPI Categories Every PM Should Know
Not every project KPI carries equal weight, but every project touches seven core categories. Think of these as the lenses through which you evaluate project health:
- Schedule performance – Are tasks and milestones hitting their planned dates?
- Cost and budget performance – Are we spending what we forecasted?
- Scope and change control – Is the project’s boundary stable, or is it creeping?
- Quality and delivery – Does the output meet acceptance criteria?
- Resource utilization – Are people allocated efficiently without burnout?
- Risk and issue management – Are threats identified, mitigated, and resolved quickly?
- Stakeholder satisfaction – Do sponsors, clients, and end-users feel heard and served?
You don’t need to track 40 indicators across all seven categories. The goal is to select 5–8 project KPIs that give you a balanced, honest picture. The sections below break down the most impactful options in each category.
Top KPIs for Schedule Performance
Time is the resource you can never buy back. These schedule-focused project tracking metrics keep deadlines visible and slippage actionable.
Schedule Variance (SV)
SV measures how far ahead or behind schedule you are in dollar or hour terms.
SV = Earned Value (EV) − Planned Value (PV)
A negative SV means you’re behind. Example: If your plan says $50,000 of work should be complete (PV) but only $42,000 is actually done (EV), SV = −$8,000. You’re behind.
Schedule Performance Index (SPI)
SPI normalizes that variance into a ratio.
SPI = EV ÷ PV
An SPI of 1.0 means perfectly on schedule. Below 1.0 means behind; above 1.0 means ahead. In our example, SPI = 42,000 ÷ 50,000 = 0.84. You’re progressing at 84% of the planned rate—a clear signal to investigate.
Milestone Completion Rate
Simply the percentage of planned milestones achieved by their target date.
Milestone Completion Rate = (Milestones completed on time ÷ Total milestones due) × 100
If 9 of 12 milestones hit their dates, your rate is 75%. This is one of the clearest project status report KPIs for executive audiences.
Critical Path Slippage
Track the number of days the critical path has shifted from the baseline. Even one day of slippage on the critical path delays the entire project finish date.
Planned vs. Actual Finish Variance
For each work package, subtract the planned finish date from the actual (or forecast) finish date. Aggregate across packages to spot systemic delays.
Tip: In earned value management (EVM), SV and SPI work best when your work-breakdown structure is granular enough to capture real progress weekly.
Top KPIs for Cost and Budget Control
Budget overruns are the fastest way to erode stakeholder trust. These cost-focused project management KPIs keep spending transparent.
Cost Variance (CV)
CV tells you whether you’re under or over budget for the work completed.
CV = EV − Actual Cost (AC)
A negative CV means overspending. If EV is $42,000 and AC is $48,000, CV = −$6,000.
Cost Performance Index (CPI)
CPI converts that variance into an efficiency ratio.
CPI = EV ÷ AC
A CPI below 1.0 means every dollar spent is producing less than a dollar’s worth of planned work. In our example, CPI = 42,000 ÷ 48,000 = 0.875. You’re getting 87.5 cents of value per dollar.
Estimate at Completion (EAC)
EAC forecasts the total project cost based on current performance.
EAC = Budget at Completion (BAC) ÷ CPI
If BAC is $200,000 and CPI is 0.875, EAC ≈ $228,571. That $28K overrun projection is exactly the kind of insight a steering committee needs early.
Estimate to Complete (ETC)
ETC shows how much more money you need from today to the finish line.
ETC = EAC − AC
Budget Burn Rate
Track actual spend per week or sprint against the planned spend curve. A sudden spike in budget burn rate—say, $15K/week instead of the planned $10K—warrants an immediate root-cause conversation.
To-Complete Performance Index (TCPI)
TCPI tells you the efficiency level the team must hit for the remainder of the project to stay within budget.
TCPI = (BAC − EV) ÷ (BAC − AC)
A TCPI above 1.0 means the team must perform better than originally planned to recover. Use it to set realistic expectations rather than wishful ones.
Scope, Quality, and Delivery KPIs
Even a perfectly on-time, on-budget project fails if it delivers the wrong thing or delivers it poorly.
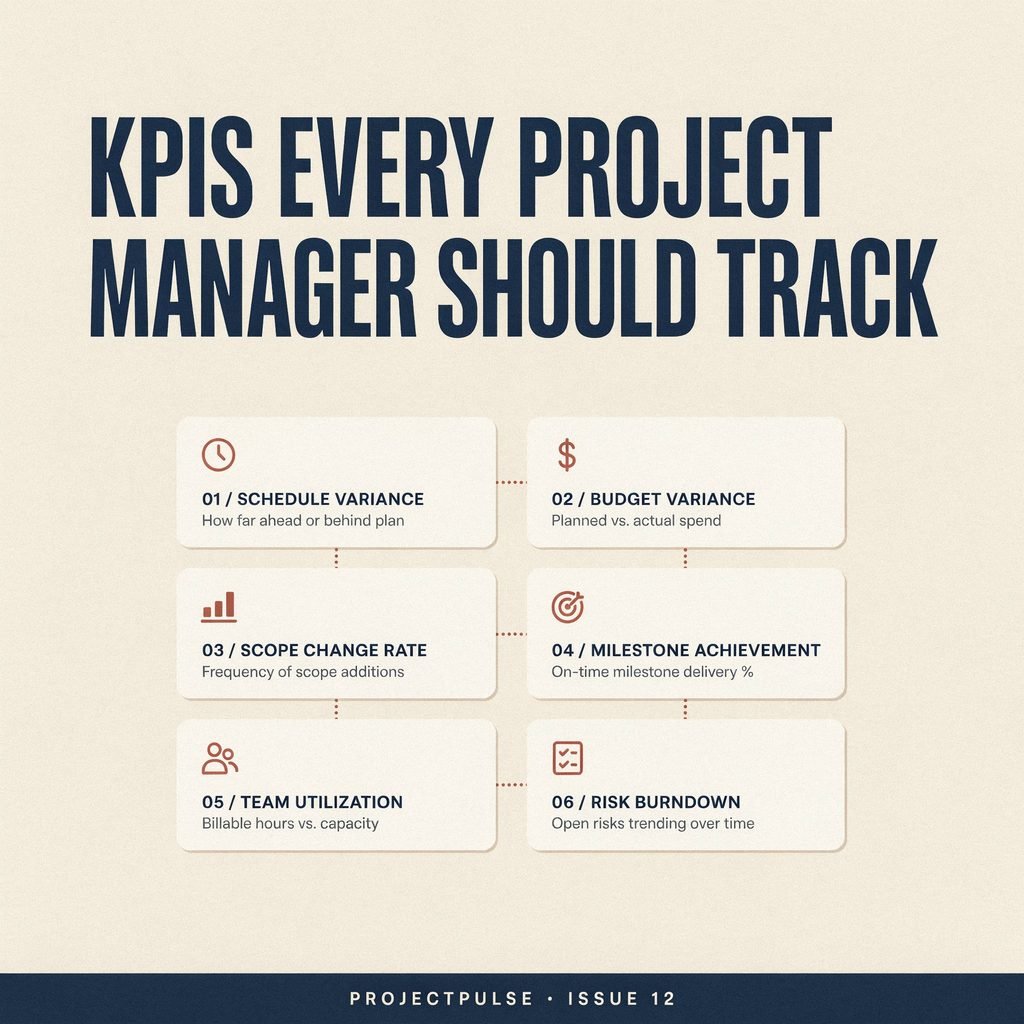
- Scope Change Request Rate. Count the number of scope change requests per week or sprint. A rising rate signals unclear requirements or stakeholder misalignment. Pair this with change control in project management processes to ensure every request is evaluated for cost and schedule impact before approval.
- Approved Change Request Percentage. Of all requests submitted, what percentage gets approved? A very high approval rate may indicate the original scope was poorly defined.
- Defect Rate / Test Pass Rate. In software project KPIs, defect rate (defects per function point or per 1,000 lines of code) and test pass rate (percentage of test cases passing on first execution) are non-negotiable. A test pass rate below 85% in late-stage QA is a red flag.
- Rework Percentage. The share of completed work that must be redone due to errors or missed requirements. High rework inflates cost and crushes team morale.
- On-Time Delivery Rate. The percentage of deliverables handed to the client or next phase by the agreed date. This single number often determines whether a client renews a contract.
These project KPIs protect the value you promised. Track them in every sprint review or phase gate.
Resource, Risk, and Stakeholder KPIs
Projects don’t run on Gantt charts alone; they run on people, assumptions, and relationships.
Resource Utilization Rate
Utilization = (Billable or productive hours ÷ Total available hours) × 100
A rate consistently above 85% signals burnout risk; below 60% suggests overstaffing or poor task allocation. This is one of the most watched PMO KPIs in professional-services firms.
Planned vs. Actual Hours
Compare estimated effort to logged effort per task or team member. Persistent gaps reveal estimation bias.
Cross-Project Resource Conflict Rate
In matrix organizations, count the number of weeks where a team member is double-booked across projects. High conflict rates delay deliverables silently.
Number of Open Risks / Risk Exposure Value
Risk exposure in projects = Probability × Impact, summed across all open risks. Watch the trend: a growing exposure value means your mitigation plans aren’t keeping pace.
Issue Resolution Time
Average days from issue logging to closure. If this climbs past your SLA, escalate.
Stakeholder Satisfaction Score
Run a short quarterly survey (1–5 scale) with sponsors and end-users. Combine it with a Sponsor Engagement Score—frequency and quality of sponsor check-ins. Low scores here predict scope disputes and cancelled projects more reliably than any spreadsheet.
How to Choose the Right KPIs for Your Project
Not every project needs the same dashboard. Use these filters:
- Match KPIs to project type. Construction project KPIs lean heavily on schedule variance, safety incident rates, and budget burn rate. Agile project KPIs emphasize sprint velocity, cycle time, and defect rate. Marketing campaigns prioritize on-time delivery rate and budget adherence per channel.
- Balance leading vs. lagging KPIs. Lagging indicators (final CV, total defects) tell you what already happened. Leading indicators (weekly SPI trend, open-risk count, sprint burndown slope) let you intervene before the damage is done. Aim for at least two leading indicators in your set.
- Avoid KPI overload. Five to eight core project KPIs per project is the sweet spot. More than that, and your team spends more time reporting than delivering.
- Align with business outcomes. If the company OKR is “reduce time-to-market by 20%,” your project dashboard KPIs should include cycle time and milestone completion rate—not just cost metrics.
Tracking KPIs: Dashboards, Tools, and Routines
A KPI is useless if no one sees it in time to act.
Simple KPI dashboard structure:
- Traffic-light status (green / amber / red) for each KPI
- Trend line over the last 4–8 reporting periods
- Owner and next action for any amber/red item
Tools to consider:
- Task and sprint tracking: Jira, Asana, Monday.com
- Scheduling and EVM: Microsoft Project, Primavera P6
- Visualization and reporting: Power BI, Tableau, Google Sheets
- All-in-one PMO: Smartsheet, Planview, Celoxis
Cadence:
- Weekly: Team-level standup review of SPI, milestone completion rate, and open issues.
- Bi-weekly or monthly: Steering-committee review of CPI, EAC, stakeholder satisfaction score, and risk exposure.
- End of phase/sprint: Retrospective on defect rate, rework percentage, and resource utilization.
The key discipline: every KPI review must end with an action item. Data without decisions is decoration.
Common KPI Mistakes to Avoid
Even well-intentioned teams trip over these pitfalls:
- Tracking too many KPIs. A 30-row dashboard guarantees nothing gets read. Curate ruthlessly.
- Focusing only on lagging indicators. By the time CPI drops to 0.7, recovery options are limited. Pair every lagging KPI with a leading one.
- Ignoring context and qualitative signals. An SPI of 1.05 looks great until you learn the team skipped code reviews to hit the date. Talk to people, not just dashboards.
- Using KPIs as punishment. If team members fear a red metric triggers blame, they’ll game the numbers. Frame KPIs as improvement tools: “What do we need to adjust?” not “Whose fault is this?”
Conclusion
The right project management KPIs turn ambiguity into clarity. They let you spot a slipping schedule in week two instead of week twelve, justify a budget conversation with hard numbers, and prove to stakeholders that their investment is in capable hands.
Start small. Pick five to eight project KPIs that map to your project’s biggest risks. Build a simple dashboard. Review it weekly. Adjust the set as the project evolves. Over time, you’ll develop an intuition for which numbers whisper warnings and which just add noise—and that’s when KPIs stop being a reporting chore and start being your most powerful leadership tool.
FAQ
What are the most important KPIs for project managers?
The essential set includes Schedule Performance Index (SPI), Cost Performance Index (CPI), milestone completion rate, budget burn rate, on-time delivery rate, and resource utilization rate. Add risk exposure and stakeholder satisfaction for a balanced view.
How many KPIs should a project manager track?
Aim for 5–8 core KPIs per project. Fewer than five leaves blind spots; more than eight creates reporting fatigue and dilutes focus. Supplement with a handful of secondary metrics reviewed monthly.
What is the difference between KPIs and metrics in project management?
Metrics are any measurable data points (hours logged, emails sent). KPIs are the select few metrics directly tied to project success criteria. Every KPI is a metric, but not every metric deserves KPI status.
How do you calculate Schedule Performance Index (SPI)?
SPI = Earned Value (EV) ÷ Planned Value (PV). An SPI of 1.0 means on schedule. Below 1.0 means behind. It’s a core component of earned value management (EVM) and one of the most widely used project performance metrics.
What are good KPIs for agile projects?
Agile project KPIs include sprint velocity, cycle time, sprint burndown slope, defect rate, test pass rate, and scope change request volume per sprint. Pair them with team happiness scores to catch burnout early.
How often should I update my project KPI dashboard?
Update task-level KPIs (SPI, burndown, open issues) weekly. Refresh financial KPIs (CPI, EAC, budget burn rate) at least bi-weekly. Review stakeholder satisfaction and risk exposure monthly or at each phase gate.